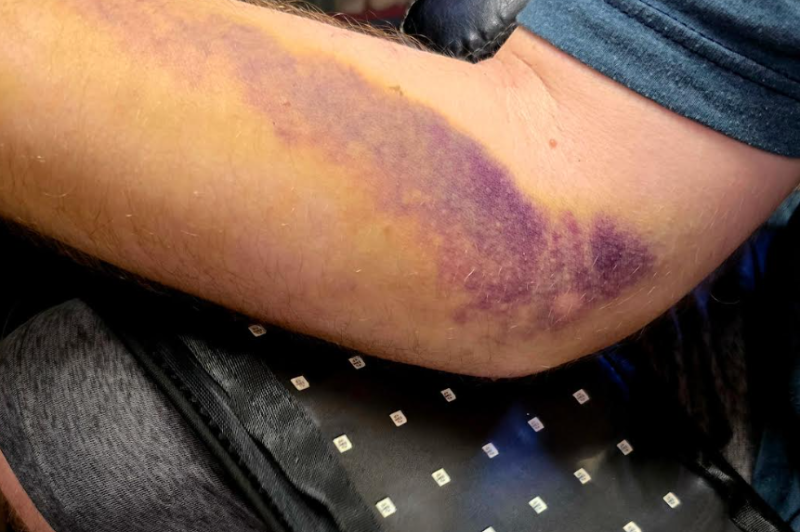
Figure 1 – Notice the pristine circular spot just below the elbow‑crease (highlighted above). This area was in direct contact with a high‑intensity 660 nm LED during a single 10‑minute red‑light session; surrounding tissue that received only diffuse spill‑light remains ecchymotic.
In the image above, a discrete 8‑mm zone is already devoid of purplish hemosiderin staining while adjacent tissue still displays classic stages of bruise chromophore breakdown. This striking differential offers a visual springboard to discuss the mitochondrial and microvascular mechanisms by which red‑light therapy (photobiomodulation; PBM) accelerates hematoma clearance and tissue repair.
Penetration & Primary Photon Interactions
| Waveband | λ (nm) | Penetration in Dermis | Principal Chromophore |
|---|---|---|---|
| Visible Red | 620–680 | 2–4 mm | Cytochrome c oxidase (CcO) |
| Near‑IR | 800–860 | 4–10 mm | CcO + Water clusters |
Red photons in the 630‑670 nm range traverse epidermis with minimal melanin absorption, reaching dermal capillaries and resident fibroblasts. Here, CcO (Complex IV of the mitochondrial electron‑transport chain, ETC) exhibits a bimodal absorption peak (~620 nm & ~665 nm) enabling resonant energy transfer.
Cytochrome c Oxidase Photodissociation
-
Nitric‑Oxide (NO) blockade – Under hypoxic or inflamed conditions, NO competitively binds to CcO’s heme a3/Cu B binuclear centre, stalling electron flow.
-
Photon action – Red‑light photons photodissociate NO, restoring the redox‑coupled binding of molecular O₂.
-
ETC restart – Electron throughput from cytochrome c to O₂ is reinstated, elevating proton motive force (∆ψ ≈ 150–180 mV) across the inner mitochondrial membrane.
-
ATP surge – ATP synthase (Complex V) exploits the proton gradient, elevating local ATP by ~30–40 % in vitro.
Reactive Oxygen Species (ROS) & Redox Signalling
A transient uptick in mitochondrial ROS (primarily superoxide → H₂O₂) at low fluence (<5 J cm⁻²) activates redox‑sensitive transcription factors:
-
Nrf2 – up‑regulates superoxide dismutase, catalase, and glutathione peroxidase.
-
NF‑κB modulation – curtails pro‑inflammatory cytokines (IL‑1β, TNF‑α).
Thus PBM establishes an anti‑inflammatory milieu conducive to bruise resorption.
Microcirculatory & Lymphatic Dynamics
-
Endothelial NO release → Vasodilation of venules, enhancing perfusion.
-
Erythrocyte deformability ↑ → Facilitates clearance of extravasated red cells.
-
Lymphangiogenesis signalling (VEGF‑C/VEGFR‑3) → Expedites macrophage‑mediated hemosiderin scavenging.
In the elbow photo, the directly illuminated locus demonstrates accelerated hemoglobin breakdown (biliverdin → bilirubin → hemosiderin → ferritin) and removal, explaining the pristine skin tone versus peripheral ecchymosis.
Photonic Dose in This Case
| Parameter | Value |
| LED Peak λ | 660 nm |
| Irradiance at skin | 50 mW cm⁻² |
| Spot size | ≈ 1 cm² |
| Exposure | 10 minutes |
| Energy density (fluence) | 30 J cm⁻² |
This falls within the Arndt‑Schulz biphasic zone where cellular stimulation (not inhibition) is maximal.
Cellular Pathways Summarised
flowchart LR
    A[660 nm photon] --> B((CcO))
    B --> |NO photodissociation| C[Electron throughput ↑]
    C --> D[Proton gradient ↑]
    D --> E[ATP synthase ↑]
    E --> F[ATP ↑]
    C --> G[ROS (H₂O₂) ↑]
    G --> H[Nrf2 activation]
    G --> I[NF‑κB down‑regulation]
    F --> J[Collagen & DNA repair ↑]
    H --> J
    I --> K[Inflammation ↓]
    J --> L[Hematoma resolution ↑]
    K --> L
Translational Take‑Home
-
Mitochondrial reboot – Photons at 660 nm rescue CcO from NO inhibition, elevating ATP for reparative biosynthesis.
-
Redox recalibration – Low‑level ROS pulses up‑regulate endogenous antioxidant defences while damping chronic inflammation.
-
Fluid dynamics – Endothelium‑derived NO induces vasodilation; lymphatics clear catabolites more rapidly.
-
Clinical phenotype – The cleared spot in Figure 1 embodies these molecular events, demonstrating how tight optical coupling (LED pressed flush) yields maximal benefit.
Practical Guidance for Home PBM
| Variable | Recommended Range |
| Wavelength | 630–670 nm (red) +/‑ 810–850 nm (NIR) combo |
| Irradiance | 20–60 mW cm⁻² |
| Fluence per session | 10–40 J cm⁻² |
| Session frequency | 1–2× daily until discoloration subsides |
Pro‑tip — Maintain the LED perpendicular and in gentle contact with the skin to minimise optical losses from Fresnel reflection and tissue scattering, mirroring the result seen near the elbow.
Limitations & Safety
-
PBM is non‑thermal at recommended doses—surface temperature rise <1 °C.
-
Contra‑indications: direct retinal exposure, active malignancy in the treatment zone, photosensitising medications.
-
Bruise colour change alone is not a diagnostic; persistent pain or swelling warrants medical evaluation.
References (abbreviated)
-
Hamblin MR (2017) Mechanisms of photobiomodulation. Photochem Photobiol Sci.
-
Avci P et al. (2013) Low‑level laser (light) therapy (LLLT) in skin. Semin Cutan Med Surg.
-
Chung H et al. (2012) Nuances in photobiomodulation dosimetry. Ann Biomed Eng.